Rate of return is “how fast” you can get back your money after you invest it. It’s expressed as a percentage per year, forever.
For example, if you invest $100 and get back $3 per year (forever), then your rate of return is 3% (Because $3 = 3% of $100)
Internal rate of return is the same as rate of return, except it’s not so easy to figure out like in the $3 example above. What if you get back $3 on the first year, but another amount in other years? And what if it’s not forever?
In this case, we figure out this “mystery” rate of return (a.k.a. internal rate of return) using the IRR or Internal Rate of Return Formula:
0 = CF1(1+irr) + CF2(1+irr)-1 +…+ CFN(1+irr)-n
DON’T panic! It’s much EASIER than it looks. Watch tutorial video below.
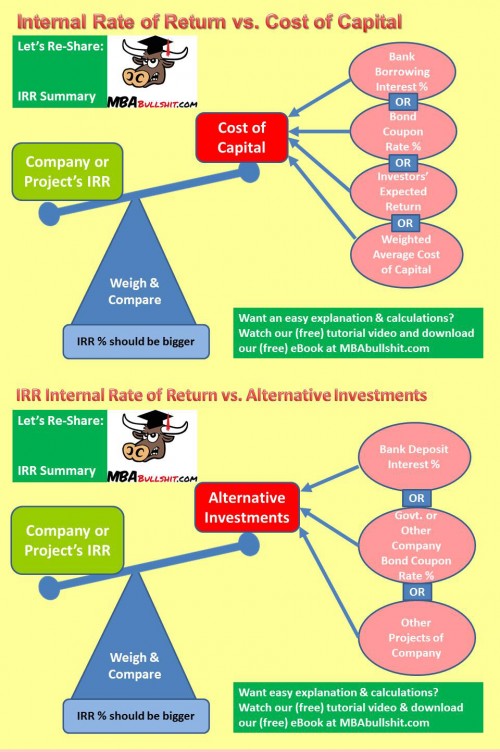
IRR is used to gauge how “profitable” a business is, taking into account the amount invested in a company or a specific project
IRR can be compared to cost of borrowing money for capital (or other sources of capital). For example: if your company’s capital comes from borrowing money from the bank at 5% interest rate, then your IRR should be higher than 5%… if your IRR is only 3%, then you are losing 2% (because 3% IRR less 5% bank interest will leave you with negative -2%)
IRR can also be compared to your alternative investment choices. Why will you do a business project and earn only 3% IRR… if you can instead invest your money in a bank’s fixed term deposit which earns 4%? You are missing an opportunity to earn an extra 1%.
3-Minute Overview: Financial Ratio Analysis Explained
Download FREE cheat-sheet PDF at the bottom of all videos below
Current Ratio
Current Ratio: (Current Assets)/(Current Liabilities)
Tells us how much of your company’s stuff can be easily changed into cash within the next 12 months so that it can pay debts which need to be paid also within 12 months.
A higher ratio (significantly above 1) indicates that the company is “less risky” for creditors, but could also indicate that the company is not efficient at using current assets for more profit.
Quick Ratio or Acid Test Ratio
Quick or Acid Test Ratio: (Quick Assets)/( Current Liabilities)
Tells us how much assets can be easily and quickly converted to cash to pay for liabilities within the next 12 months.
Similar to current ratio, a higher number indicates that the company is “less risky” for creditors, but could also indicate that the company is not efficient at using short term assets for profit.
Cash Ratio
Cash Ratio: (Cash/Current Liabilities)
Similar to the current ratio and even more stringent than the Quick Ratio, as we only compare cash with current liabilities instead of all current assets to current liabilities. Why? Because you cannot easily use all of your current assets to pay your debts.
ROA Ratio Return on Assets
ROA or Return on Assets: (Net Income)/(Total Assets)
Higher ROA indicates that the company is more efficient in using assets to generate profit; a lower ROA indicates that the company is less efficient in using assets to generate profit.
ROE Ratio Return on Equity
ROE or Return on Equity: (Net Income)/(Total Equity)
A higher ROE indicates that the company is more efficient in giving more profit to the company’s owners compared to these owners’ personal investment in the company.
Profit Margin Ratio
Profit Margin Ratio: (Net Income)/(Sales)
Tells us how much profit your company earns compared to your company’s sales. Normally, a higher number is better; because you want to earn more profit for every $1 of sales that you get.
EPS Earnings Per Share
EPS or Earnings Per Share: (Net Income)/(# Shares Outstanding)
Tells us how much proportion of income the holder of one share of stock is entitled to. VERY UNRELIABLE ratio because even companies of same size or profitability may have different number of outstanding shares.
P/E Ratio or Price Earnings Ratio
P/E or Price Earnings Ratio: (Share’s Market Price)/(Earnings Per Share)
A low Price Earnings Ratio can be good because it means the market price is low compared to how much profit the company is making; but can also be bad because “why is it selling cheap?” Maybe they’re expecting bad news in the future.
7 Turnover Ratios – Premium Video (Free Preview)
5 Financial Leverage Ratios – Premium Video (Free Preview)
It’s not enough to simply say a company is in “good or bad” health…
We put numbers on this “health,” so that we can compare these “health numbers” with the numbers of other companies…
One form of “health numbers” are “ratios” which is basically different numbers combined into just one number to make it “simpler.”
For example, if a company has current assets of $1,000 (one number) and current liabilities of $800 (another number), these two numbers can be combined $1,000/$800 into just one number of 1.25 (1000/800=1.25) which in this example is the “current ratio.”
Of course, because of this “1-number simplicity,” it doesn’t tell the ‘whole story’ and they are not completely reliable. There are many flaws and many different ways of understanding individual financial ratios, which I cover deeply in the FREE videos above. (I suggest you watch them.)
Liquidity Ratios can tell us how easily a company can pay its debts… so that the company doesn’t get eaten up by banks or other creditors. An example is the Current Ratio (as above).
Profitability Ratios can tell us how good a company is at making money. An example of this is the Profit Margin Ratio.
Leverage ratios tell us how much debt the company is using to make the company run and stay alive. An example of this is the simple Debt Ratio.
Stocks throughout the stock market typically rise in price once you can find good news relating to a stock’s company. Conversely, they regularly move lower when you can find bad news regarding a business enterprise.What are the reasons? In the event that excellent news about a stock appears (along the lines of, as an illustration, information in which the institution earned loads of income), consequently every person instantly desires to buy the stock, to make sure that they can gain from the higher earnings.Once every person works to obtain the stock, the higher “demand” for the stock brings up the price tag.
Therefore, a fantastic way for you to earn money utilizing stocks will be to procure the stock in the event that something superb transpires with the corporation (illustration: it strikes oil) however before the great news is released to the general public… and while the stock price is still down. (After the company strikes oil, it may take 1 or maybe even 2 days for the general public to know about this from the reports.)And next, after the excellent news has come out, everyone else is going to make an effort to purchase the stock, and the stock price will rise. Generally if the stock price is already high, you’ll be able to sell your stock at a high value and earn a superb profit. With this type of scenario, whom do you think must have a great plus? The best chum of the enterprise chief executive or the regular people?
Needless to say, the best preferred friend of the enterprise chief is at a great convenience! He is able to get to know from this chief executive-chum in relation to the company striking oil prior to everyone else! And subsequently, he can pick up the stock at which instance it’s as yet at a reduced selling price. And then, he can certainly only wait around one or 2 days for the reports to get going to the usual masses and for the whole community to kick off buying the share; which actually will propel up the stock price. After that, the chief executive’s mate may well basically sell at the larger rate and get an easy instant income. Nonetheless suppose… information journeyed speedily. What if, at the time the firm struck oil, the universal community is likely to find out about it essentially very fast; really as quick as the company chief’s chum? How?
Maybe the newscast information is actually indeed “competent” in getting and relaying facts (similar to some “embedded” reporters). Or alternatively perhaps, even in the event the news channel is unhurried, social media (like Facebook or Twitter) helps move the information incredibly rapidly (perhaps a staff member at the oil well immediately tweets it and it gets retweeted multiple instances over the whole world after only a short time). In such a case, will the company director’s buddy remain to have an advantage? Obviously, the answer is certainly no. That may be the heart of the Efficient Market Hypothesis. In the event that market information travels incredibly fast, without difficulty and also essentially instantaneously (having “strong” market efficiency), firm officers, their acquaintances, as well as other people utilizing “inside” information tend not to own an edge above the standard masses when considering trading in shares of stock.
The reverse is moreover said to be right. If market facts travels gradually over time and very inefficiently (with “weak” market efficiency), consequently firm officers, their close companions and additional individuals having “inside” information own a major leverage against the universal masses when it comes to flipping in stocks. There may be additionally a scheme in between the two extremes earlier mentioned. In case market information travels not too fast but not overly sluggish either, then institution officers and their buddies own some advantage in opposition to the universal public when it comes to trading in stocks.
This is known as “semi-strong” market efficiency. The bottom line is: Institution officers and “mates” of company officers only own better chances when data flows slowly and also “inefficiently.” In the event that the information in the market moves almost instantaneously and “efficiently,” then firm officers and intimate friends really do not develop an edge and cannot successfully “invest on the information.”
CAPM is just a “model” or formula used to calculate COST OF EQUITY
Cost of Equity is how much an investor “wants” to earn for investing in a company which is more risky than a safe bank deposit (or government bond), and (usually) more risky than investing in the general stock market with a bunch of stocks.
It’s called a “cost” because that’s how much you should “fairly” pay your investors for investing in your risky company.
CAPM assumes that investing in many stocks is safer than investing in just one company’s stock: “don’t put all your eggs in one basket” sorta thing.. this is called “diversified” risk
Rationale: An investor would “want” (or “expect”) more income (“return”) for investing in a highly risky company instead of the zero-risk bank/bond, and also instead of investing in a “medium-risk” general stock market. Therefore, cost of equity = “expected return”
You calculate Cost of Equity using the CAPM or Capital Asset Pricing Model Formula:
Ke = Rf + B (Rm-Rf)
DON’T panic! It’s MUCH EASIER than it looks! See this formula step-by-step in action, watch it for free in the video above.
We use cookies to ensure that we give you the best experience on our website. If you continue to use this site we will assume that you are happy with it.